Unit 2.3 Extracting Information from Data, Pandas
Data connections, trends, and correlation. Pandas is introduced as it could be valuable for PBL, data validation, as well as understanding College Board Topics.
- Files To Get
- Pandas and DataFrames
- Cleaning Data
- Extracting Info
- Create your own DataFrame
- Example of larger data set
- APIs are a Source for Writing Programs with Data
- Hacks
Files To Get
Save this file to your _notebooks folder
Save these files into a subfolder named files in your _notebooks folder
wget https://raw.githubusercontent.com/nighthawkcoders/APCSP/master/_notebooks/files/data.csv
wget https://raw.githubusercontent.com/nighthawkcoders/APCSP/master/_notebooks/files/grade.json
Save this image into a subfolder named images in your _notebooks folder
wget https://raw.githubusercontent.com/nighthawkcoders/APCSP/master/_notebooks/images/table_dataframe.png
Pandas and DataFrames
In this lesson we will be exploring data analysis using Pandas.
- College Board talks about ideas like
- Tools. "the ability to process data depends on users capabilities and their tools"
- Combining Data. "combine county data sets"
- Status on Data"determining the artist with the greatest attendance during a particular month"
- Data poses challenge. "the need to clean data", "incomplete data"
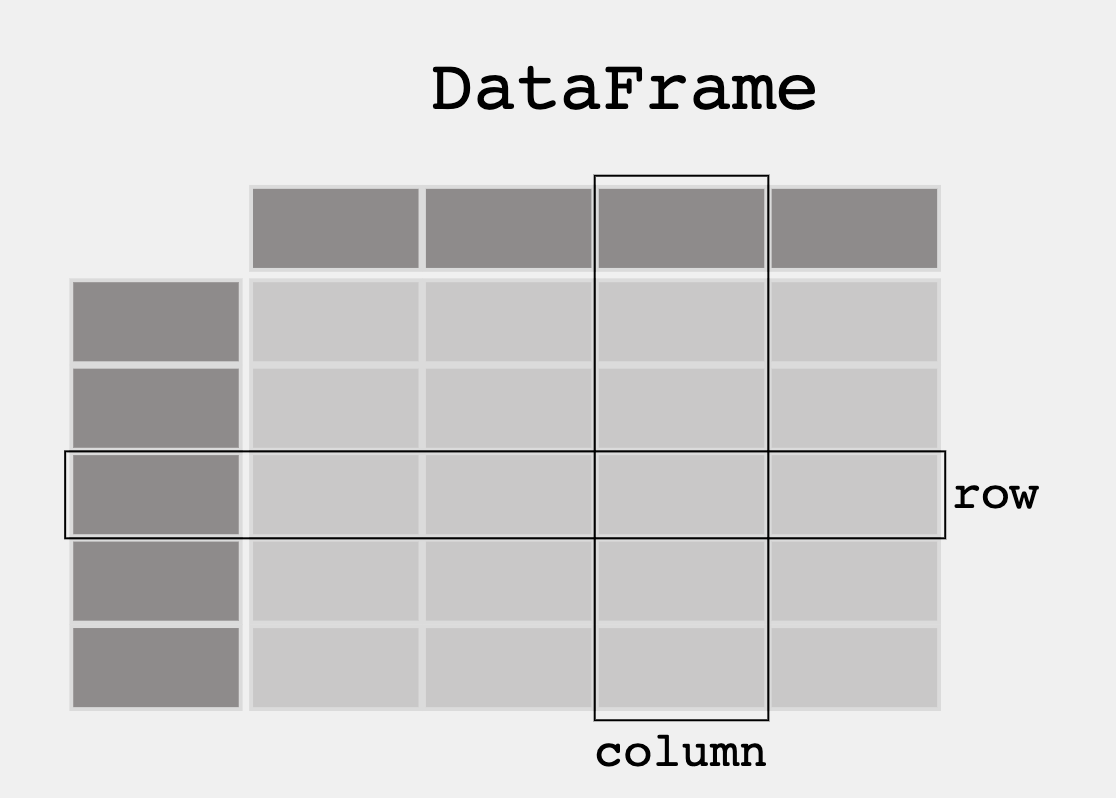
- From Pandas Overview -- When working with tabular data, such as data stored in spreadsheets or databases, pandas is the right tool for you. pandas will help you to explore, clean, and process your data. In pandas, a data table is called a DataFrame.

'''Pandas is used to gather data sets through its DataFrames implementation'''
import pandas as pd
df = pd.read_json('files/grade.json')

print(df)
# What part of the data set needs to be cleaned?
# From PBL learning, what is a good time to clean data?  Hint, remember Garbage in, Garbage out?
print(df[['GPA']])

print()

#try two columns and remove the index from print statement
print(df[['Student ID','GPA']].to_string(index=False))
print(df.sort_values(by=['GPA']))

print()

#sort the values in reverse order
print(df.sort_values(by=['GPA'], ascending=False))
print(df[df.GPA > 3.00])
print(df[df.GPA == df.GPA.max()])
print()
print(df[df.GPA == df.GPA.min()])
import pandas as pd

#the data can be stored as a python dictionary
dict = {
  "calories": [420, 380, 390],
  "duration": [50, 40, 45]
}
#stores the data in a data frame
print("-------------Dict_to_DF------------------")
df = pd.DataFrame(dict)
print(df)

print("----------Dict_to_DF_labels--------------")

#or with the index argument, you can label rows.
df = pd.DataFrame(dict, index = ["day1", "day2", "day3"])
print(df)
print("-------Examine Selected Rows---------")
#use a list for multiple labels:
print(df.loc[["day1", "day3"]])

#refer to the row index:
print("--------Examine Single Row-----------")
print(df.loc["day1"])
print(df.info())
import pandas as pd

#read csv and sort 'Duration' largest to smallest
df = pd.read_csv('files/data.csv').sort_values(by=['Duration'], ascending=False)

print("--Duration Top 10---------")
print(df.head(10))

print("--Duration Bottom 10------")
print(df.tail(10))
'''Pandas can be used to analyze data'''
import pandas as pd
import requests

def fetch():
    '''Obtain data from an endpoint'''
    url = "https://flask.nighthawkcodingsociety.com/api/covid/"
    fetch = requests.get(url)
    json = fetch.json()

    # filter data for requirement
    df = pd.DataFrame(json['countries_stat'])  # filter endpoint for country stats
    print(df.loc[0:5, 'country_name':'deaths']) # show row 0 through 5 and columns country_name through deaths

fetch()
Hacks
Early Seed award
- Add this Blog to you own Blogging site.
- Have all lecture files saved to your files directory before Tech Talk starts. Have data.csv open in vscode. Don't tell anyone. Show to Teacher.
AP Prep
- Add this Blog to you own Blogging site. In the Blog add notes and observations on each code cell.
- In blog add College Board practice problems for 2.3.

The next 4 weeks, Teachers want you to improve your understanding of data. Look at the blog and others on Unit 2. Your intention is to find some things to differentiate your individual College Board project.
-
Create or Find your own dataset. The suggestion is to use a JSON file, integrating with your PBL project would be Amazing.
-
When choosing a data set, think about the following...
- Does it have a good sample size?
- Is there bias in the data?
- Does the data set need to be cleaned?
- What is the purpose of the data set?
- ...
-
Continue this Blog using Pandas extract info from that dataset (ex. max, min, mean, median, mode, etc.)
'''Pandas can be used to analyze data'''
import pandas as pd
import requests

def fetch():
    global
    '''Obtain data from an endpoint'''
    url = "https://fruitteam.duckdns.org/api/players/"
    fetch = requests.get(url)
    json = fetch.json()

    # filter data for requirement
     = pd.DataFrame(json)  # filter endpoint for country stats
    print(.loc[0:1, 'id':'name']) # show row 0 through 5 and columns country_name through deaths

fetch()
import pandas as pd
import requests

# GET code
url = "https://edamam-food-and-grocery-database.p.rapidapi.com/parser"

headers = {
	"X-RapidAPI-Key": "32d5282f94msh36a081cfb06e672p1c2a8cjsn851d00873829",
	"X-RapidAPI-Host": "edamam-food-and-grocery-database.p.rapidapi.com"
}

response = requests.request("GET", url, headers=headers) #fetch with no query
json = response.json()

fooddata = [] #for appending data here
for data in json['hints']: #reformatting the information for the pandas table
	newdict = {'Name':data['food']['label'],
		'Calories':data['food']['nutrients']['ENERC_KCAL'],
		'Protein (g)':data['food']['nutrients']['PROCNT'],
		'Fat (g)':data['food']['nutrients']['FAT'],
		'Carbohydrates (g)':data['food']['nutrients']['CHOCDF'],
		'Fiber (g)':data['food']['nutrients']['FIBTG']}
	fooddata.append(newdict)

fooddf = pd.DataFrame(fooddata)
#print(fooddf)
print(fooddf.loc[0:5, 'Name':'Fat (g)'].sort_values(by=['Protein (g)'], ascending=False))